How to use Volume in Trading? Many Traders don’t know what is the Trading Volume. Others instead ignore how to use it. Besides, many traders ignore what start and stop a trend. They don’t know what creates a Sharp Supply Action or Demand Action. So, they have no idea how to take advantage of them.
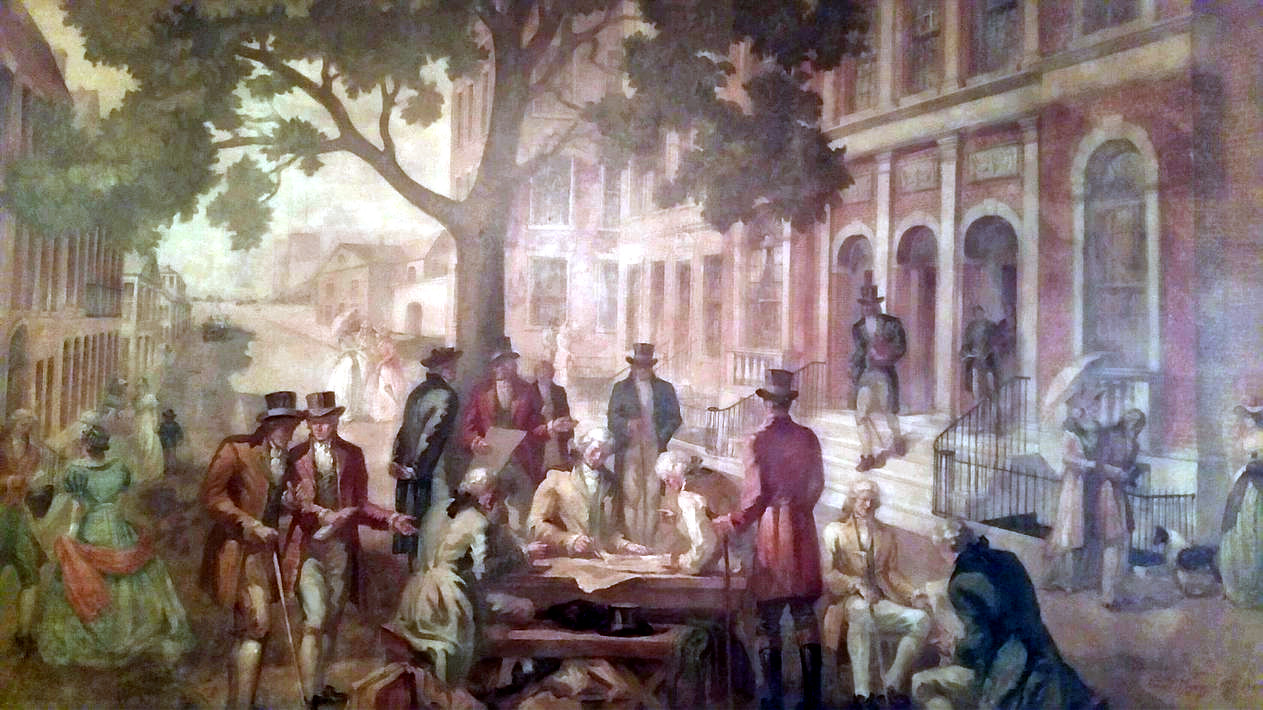
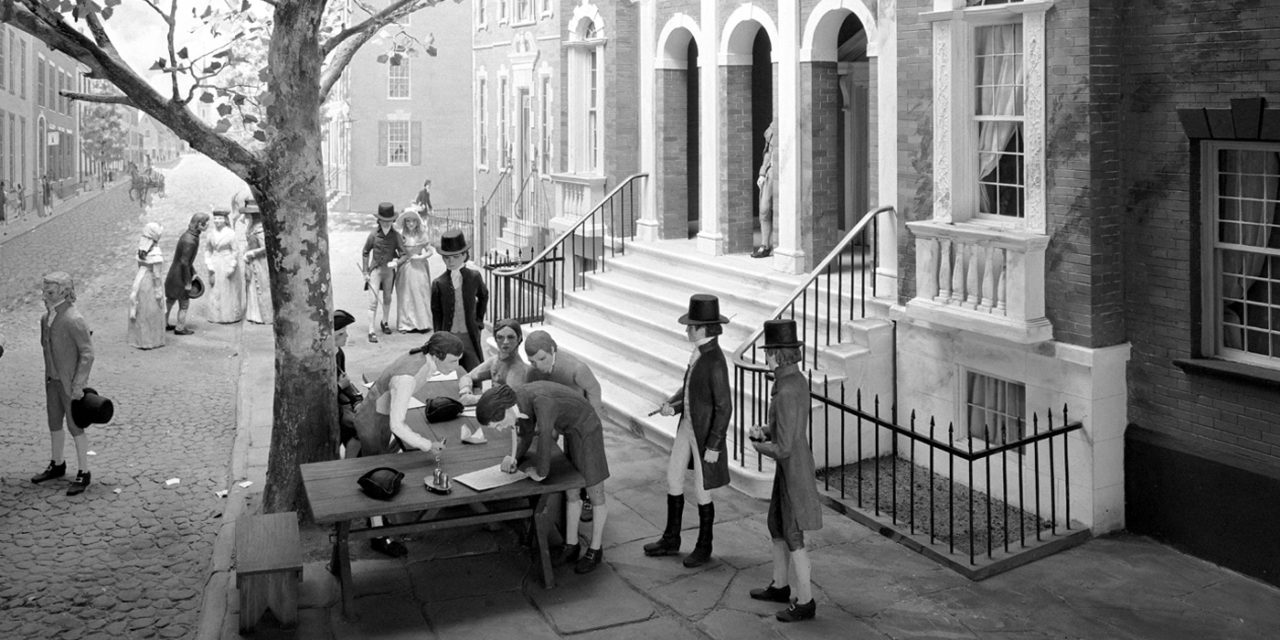
A long time ago, Trading was very different than today. 24 Brokers signed the Buttonwood Agreement in Wall Street. This agreement created the first shape of the NYSE in 1792, the New York Stock & Exchange Board. Later, on March 8, 1817, it had the official establishment.
The American Stock Exchange was born under a Buttonwood Tree. But it existed only by deals between brokers. Indeed, they agreed to only trade with one another limiting commissions to 0.25%.
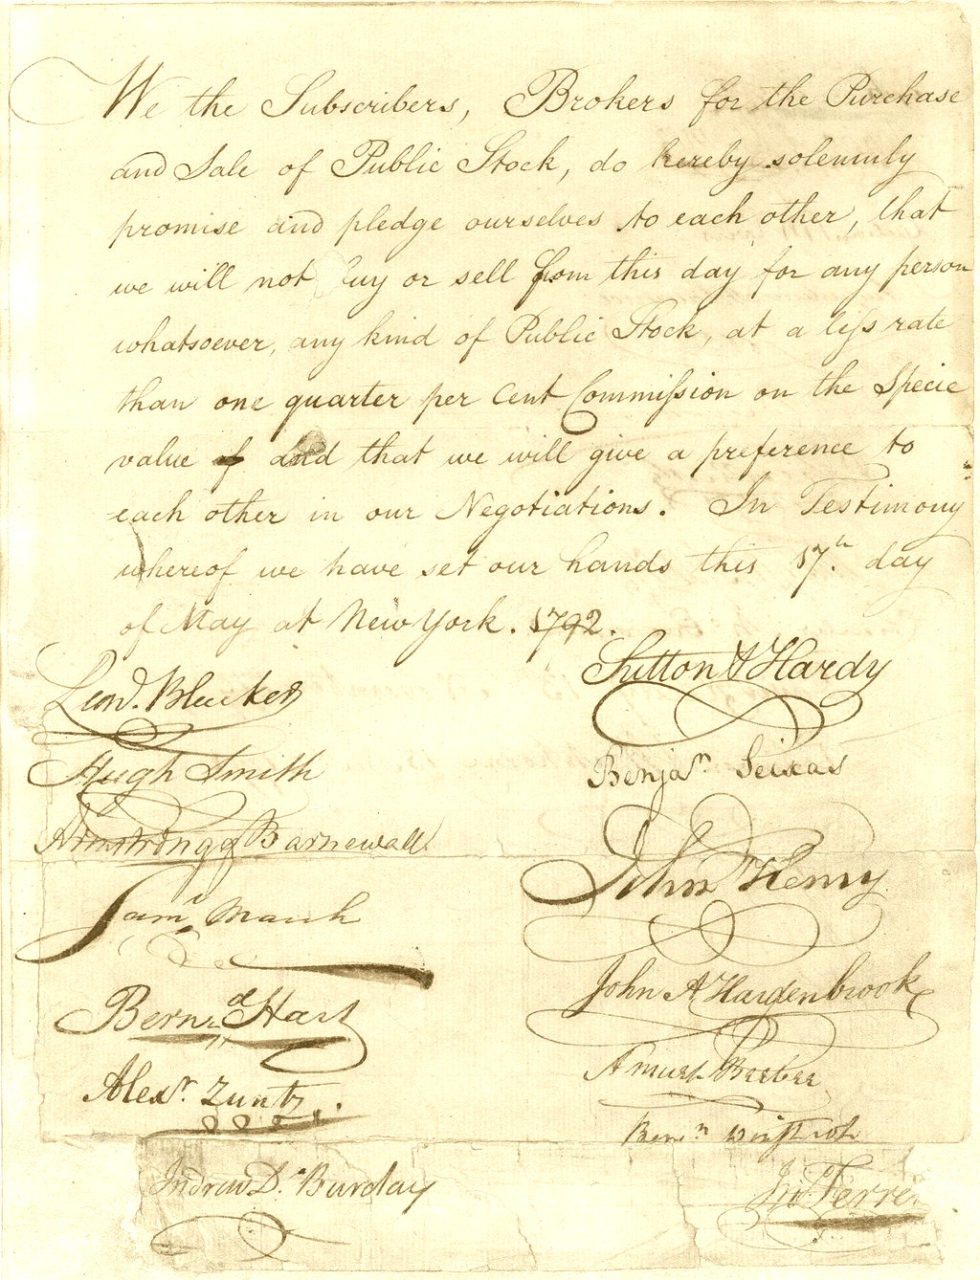
The Buttonwood Agreement says:
We the Subscribers, Brokers for the Purchase and Sale of the Public Stock, do hereby solemnly promise and pledge ourselves to each other, that we will not buy or sell from this day for any person whatsoever, any kind of Public Stock, at a less rate than one quarter percent Commission on the Specie value and that we will give preference to each other in our Negotiations. In Testimony whereof, we have set our hands this 17th day of May at New York, 1792.
So, the Stock Exchanges had no particular technology. No computers. No mathematicians. Only people who traded Public Stocks.
Going forward, there was the need to count the transactions and to report the counting to brokers. So, later the Trading Volume Report was available with a daily base count. The counting was a handmade job.
The Volume of Negotiations has changed the way to make trading.
How to use Volume in Trading is something that every trader should learn.
Trading Volume
The Volume is the counting of the trades occurred during a given period of time.
The counting happens in a context. Indeed, operators count trades in a Market Exchange so as in a Financial Instrument. The counting happens in the same way.
Then you can know the trades occurred for a trading route, so as for a Stock. In the same way, you can know the Volume for a Sector, for the whole NYSE or NASDAQ and others.
Investopedia gave a very exhaustive explanation about What is Volume:
What I like the most of this definition is that it is specific. You can disrupt it in several crucial elements:
- Volume is the number of share or contracts traded during a specific period of time.
- Volume counts shares or contracts traded in a security or in an entire market.
- For every buyer, there is a seller.
- Each transaction contributes to the count of the Total Volume.
- One transaction is an agreement between buyers and sellers at a certain price.
- If only five transactions occur in a day, the volume for the day is five.
These are important points. They show in a clear and simple way what is the Volume and how it rises.
Having in mind these simple concepts, everybody is able to understand the Volume. So, everybody has all he needs to understand How to use Volume in Trading.
Trading Volume and Third Law of Wyckoff
Trading Operators trade a Financial Instrument in a different way than what retail traders use to do. They develop the work of the Institutional Investors and Private Funds. Indeed, the Composite Operator shows how Trading Operators act.
The Composite Operator changes the price behavior in a consistent way. It makes this with a specific purpose.
The work of the Composite Operator is to reverse the trend or continue a previous trend, accumulating or distributing securities.
A rising in volume over a top, in a strong price movement, shows an action of the Trading Operators. So, you can understand where and why the price behavior can get a stop, watching the rising of the Volume.
This is the starting point for every volume trading strategy. Then, it is a crucial detail about How to use Volume in Trading.
The rising in volume over a top (or over an average) shows a consistent changing of the Effort on market. It shows how a higher numbers of transactions can affect the market.
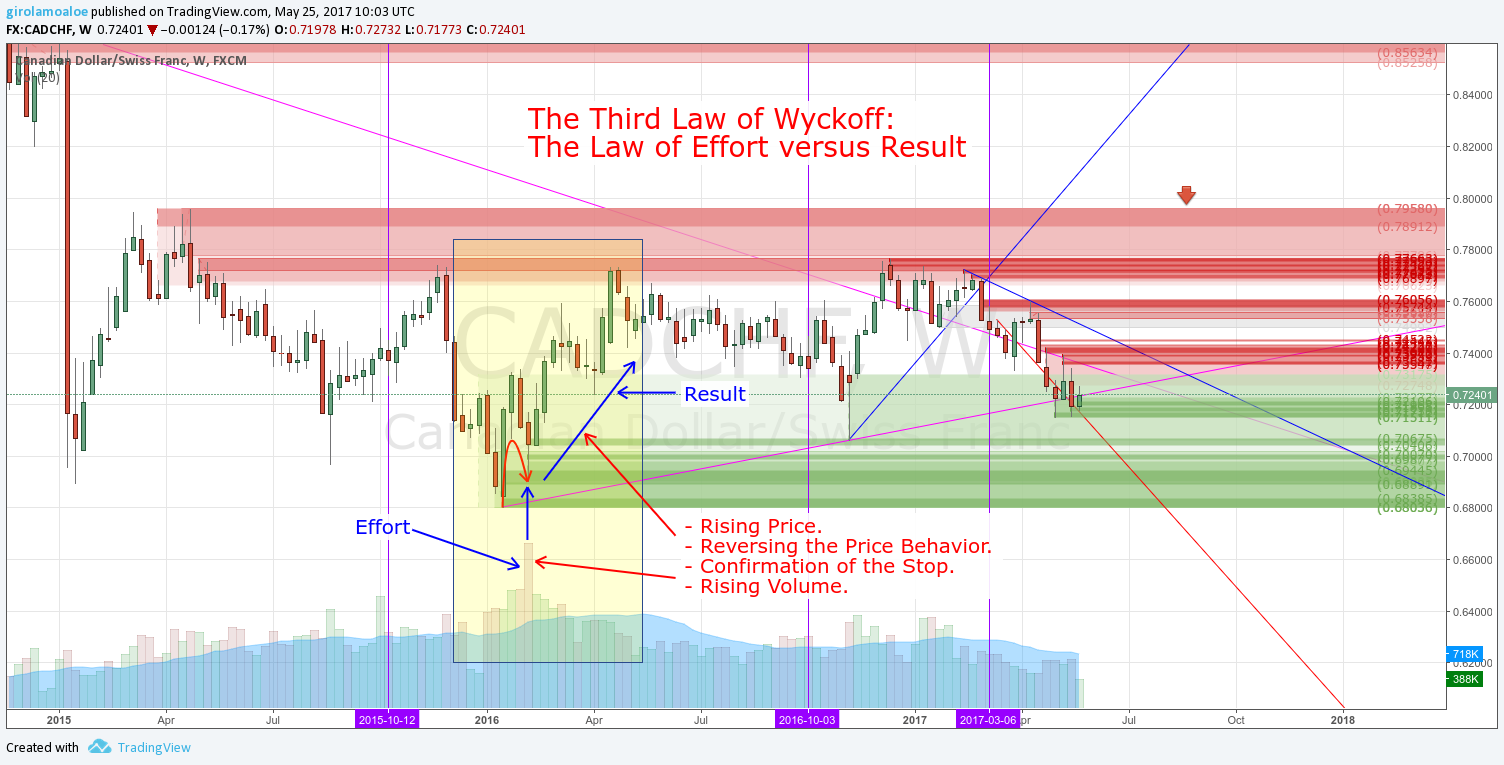
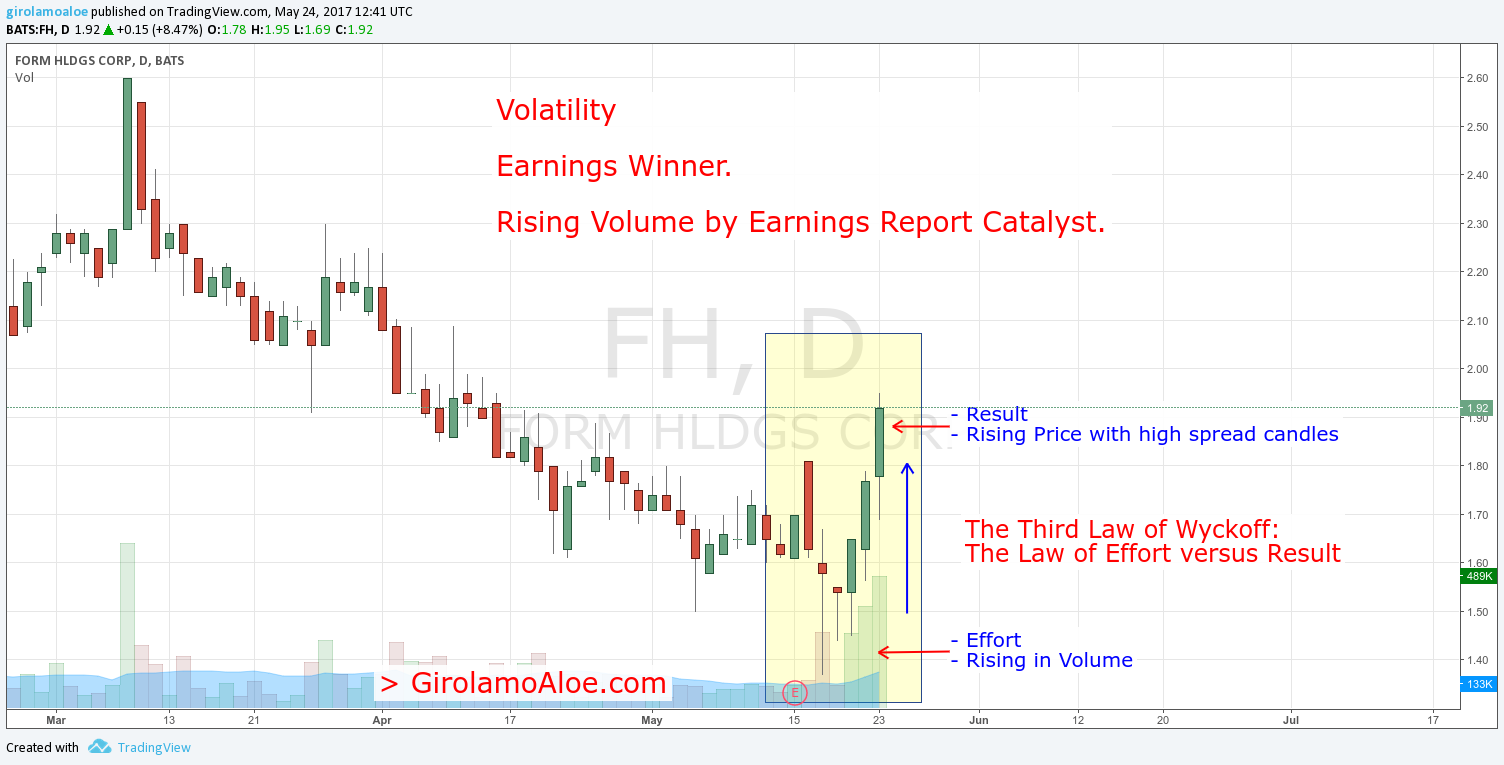
Indeed, the Third Law of Wyckoff describes the impact of the volume on the price behavior:
The Law of Effort versus Result
The Changing in the Volume Negotiations is the Effort and the Price Changing is the Result. The Effort causes a Result and it is proportional to the Effort. If the Effort and the Result are opposite you could expect a changing of the trend.
Average Trading Volume
The Average Trading Volume is the total amount of transactions per unit of time.
When the unit of time is the trading day you can talk about Average Daily Trading Volume.
Having a long period, it is the ratio between the total amount of transactions and the length of the period.
The trading activities depend on the Volume of Negotiations. Then, stock volume analysis and Forex volume data become relevant for your trading.
The volatility and the liquidity depend on the number of individual securities traded.
The stock average volume has a high relevance for trading. But this not limited only to stocks. Every financial instrument in any marketplace take advantages from the volume spread analysis rules.
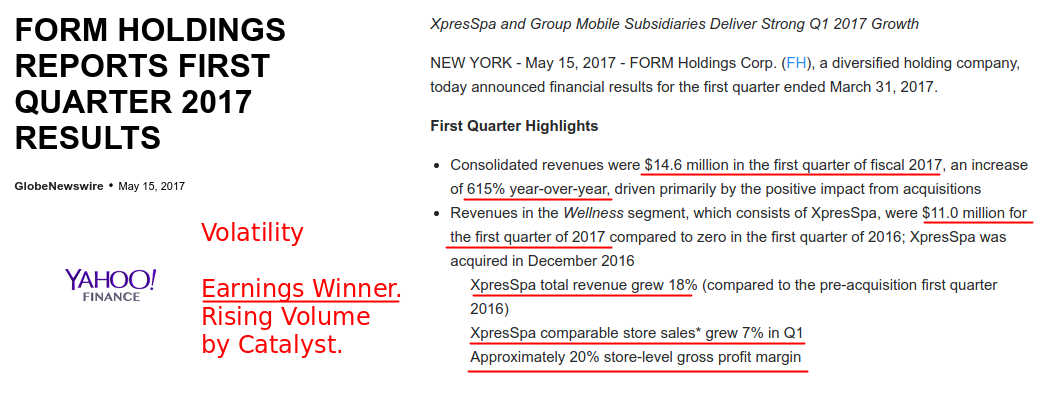
Volatility
The Volatility is the rising or falling of a security or marketplace within a short period of time.
The rising of the volume over a top or an average gives a fast price change in the short term.
Indeed, a Volatile market has price fluctuations that sometimes are very wide.
It is also a statistical measure that shows the tendency of a security so as of a marketplace.
What is usual to see day by day, is a catalyst that induces volatility. For example, an Economic Calendar Report or an Agreement Signed that medias are pumping.
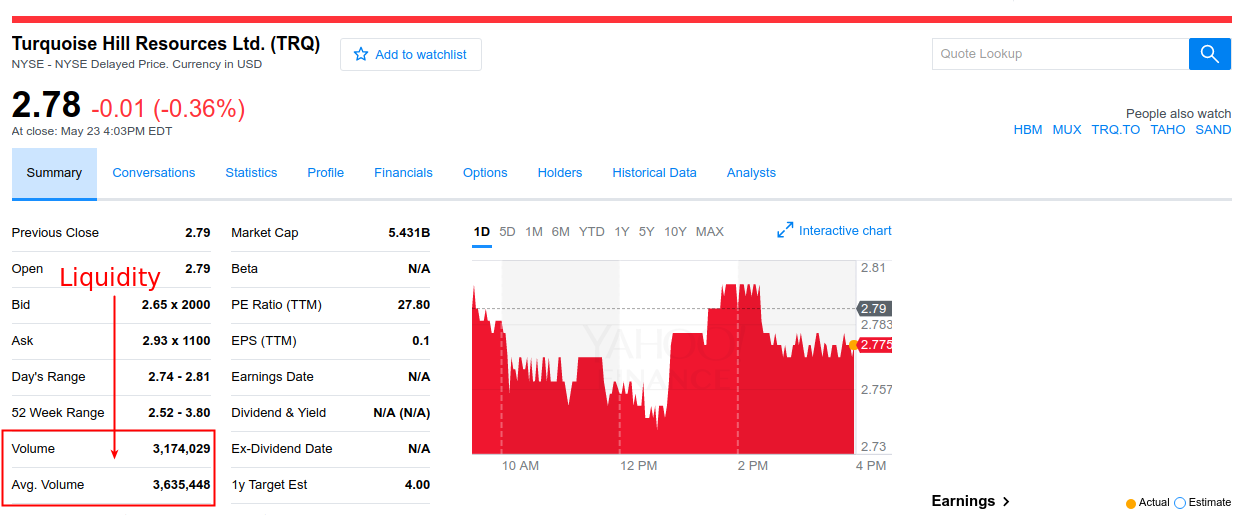
Liquidity
The Liquidity is a high average trading volume. It says that there is a high number of transactions per unit of time.
Then, day by day there are many buyers and sellers who want to take or distribute securities. This makes trading easy and the bid-ask spread low.
Trading is easy because the risk to don’t give away the securities that you own is almost zero. In the same way, if you want to take more for your portfolio the offer of securities is plentiful.
This is the reason for which in a Non-Liquid Market is necessary to wait for a rising in volume. Besides, your have to understand what is the cause of the higher than average volume. Then, before to trade, you have to look for the catalyst that induced people to trade.
How to Use Volume in Trading
By the Third Law of Wyckoff, you can analyze the price behavior looking to the changing in volume:
The Effort applied by transactions affects the price behavior.
This opens the door to a price volume relationship analysis. It means, that you can look for Supply Demand Imbalances by the rising of the Trading Volume.
To report the counting, any Trading Volume tool uses Bar Charts. So the rising of the number of contracts traded in a given period, make grow a bar. The bar candle in the volume chart is a way to measure the strength.
When buyers and sellers close a high number of contracts around a price, the volume rises.
The higher number of transactions around a price gives a Higher than Average Volume.
Then, on the chart, you get a volume bar so high to catch your attention. This volume bar becomes a reference point for trading.
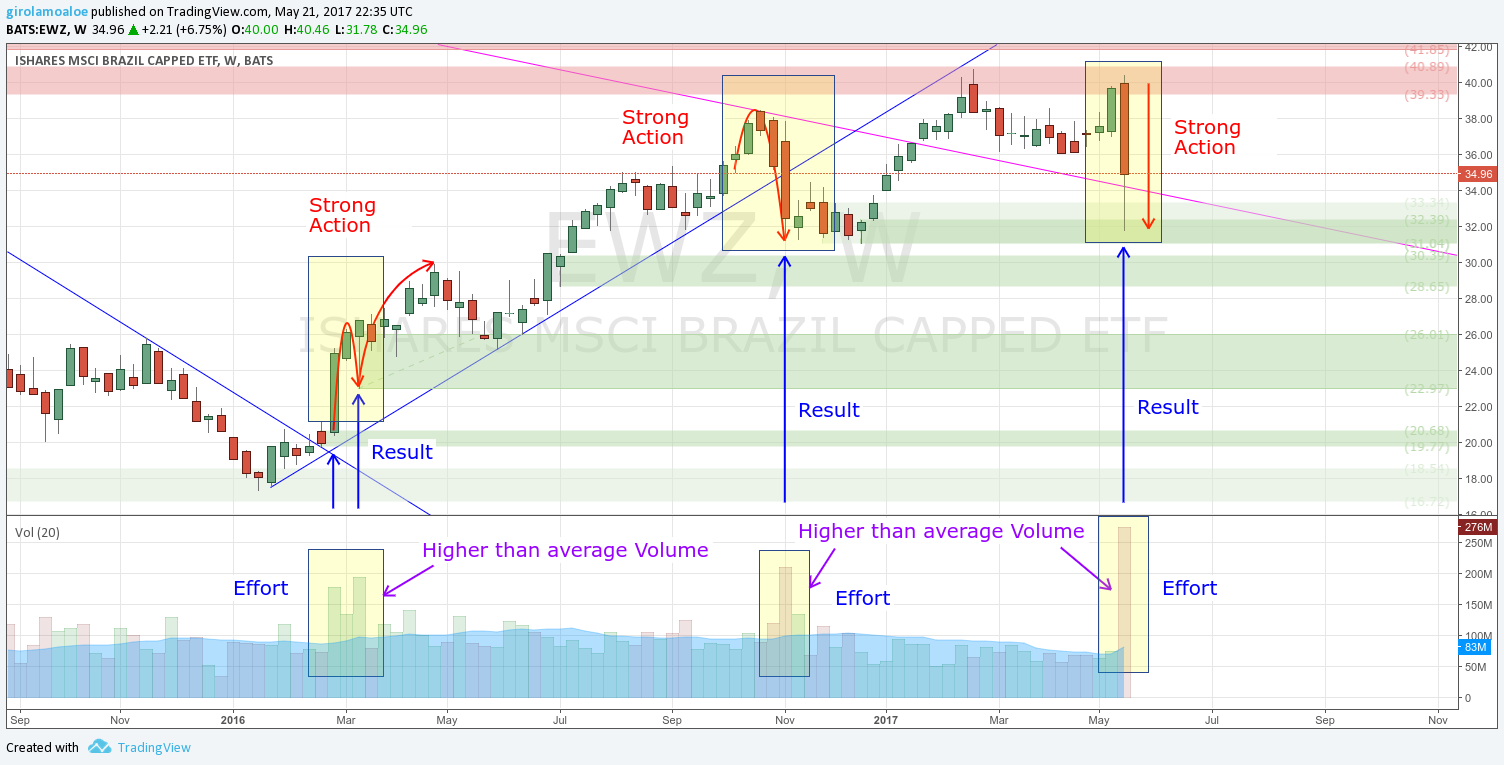
A Higher than Average Volume bar shows a higher than usual Effort applied on market.
When the price runs by a relevant increasing of the volume, it shows a Strong Trading Action.
Then, you understand how to use Volume in Trading taking attention on Higher Volume Bars. These Higher than Average Volume bars let you make appropriate trading volume analysis.
A Higher than Average Volume is a clue of a strong action that is pushing the price in a direction. Besides, it is a clue of reversal point. Then, it is a clue that a Supply Imbalance so as a Demand Imbalance is going to happen.
Effort and Supply Demand Imbalances
To understand How to use Volume in Trading, you must have clear the relation between Effort and Supply Demand Imbalance.
According to the First and the Third Laws of Wyckoff, the Price Action is the result of Supply Demand Imbalances. Besides, Supply Demand Imbalances exist because of the Effort.
You can see it checking how the Trading Volume affects the price behavior. Then, you can understand how the Volume Effort shows supply and demand actions.
By Supply and Demand Willing the price can persist in its behavior so as reverse a trend.
The First Law of Wyckoff describes how Supply and Demand impact on a security or even a marketplace:
The Law of Supply Demand
When the demand willing exceeds the supply willing, the price rises. In the same way, when the supply willing exceeds the demand willing the price falls. Supply and Demand willing gives a direction to the market and rules the Wyckoff Market Cycle.
Supply Action and Demand Action
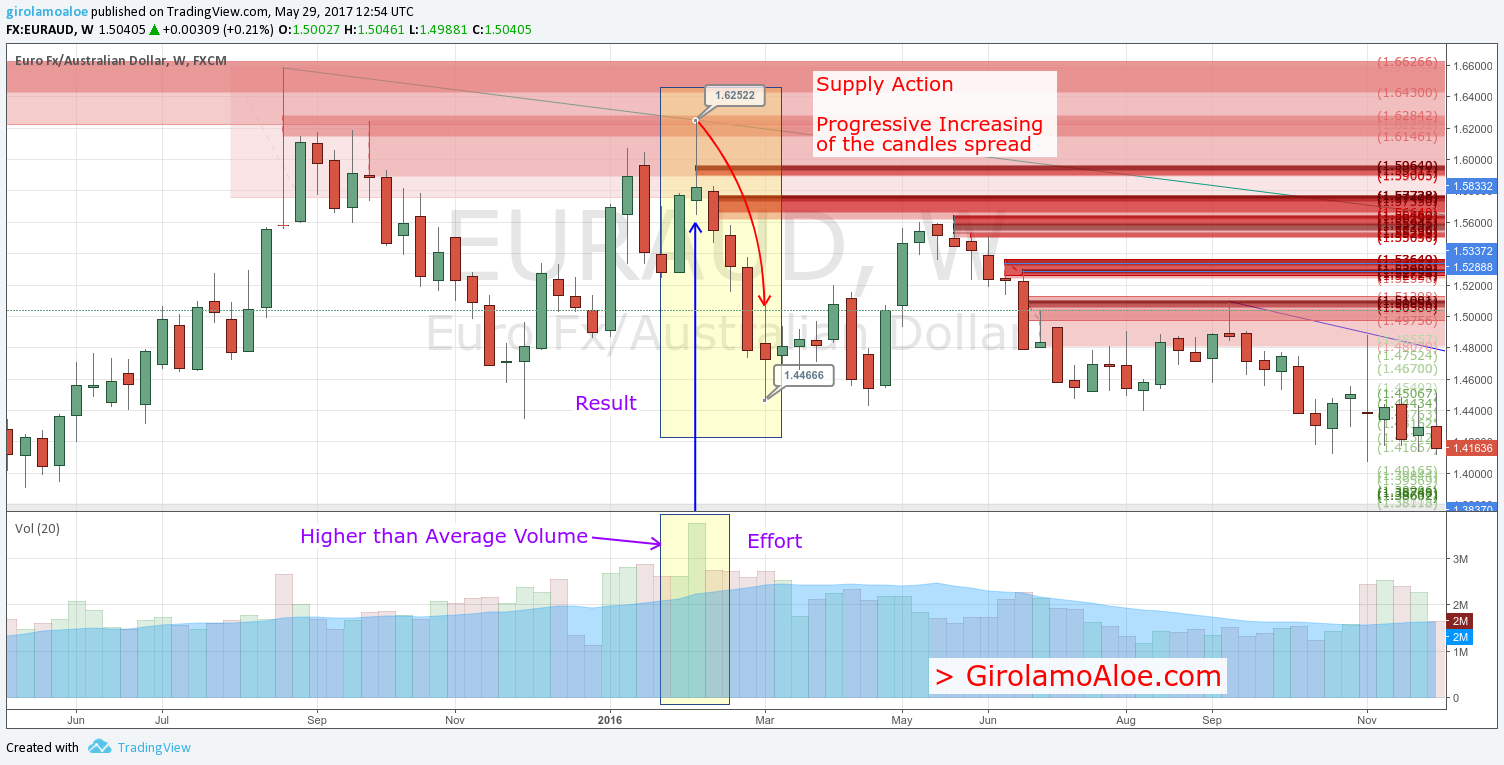
Price Candles with higher spread and higher than average volume show a Supply Demand Action.
A Demand Action is a price rising with a progressive increasing of the candles spread. This happens by the support of a higher than average volume.
A Supply Action is a price falling with a progressive increasing of the candles spread. This happens by the support of a higher than average volume.
The reason is the Effort by the prevailing of buyers or sellers in the increasing of the transactions. The higher number of securities traded increases the count of the Trading Volume. Then, the Volume grows becoming higher than the average so as higher than the top.
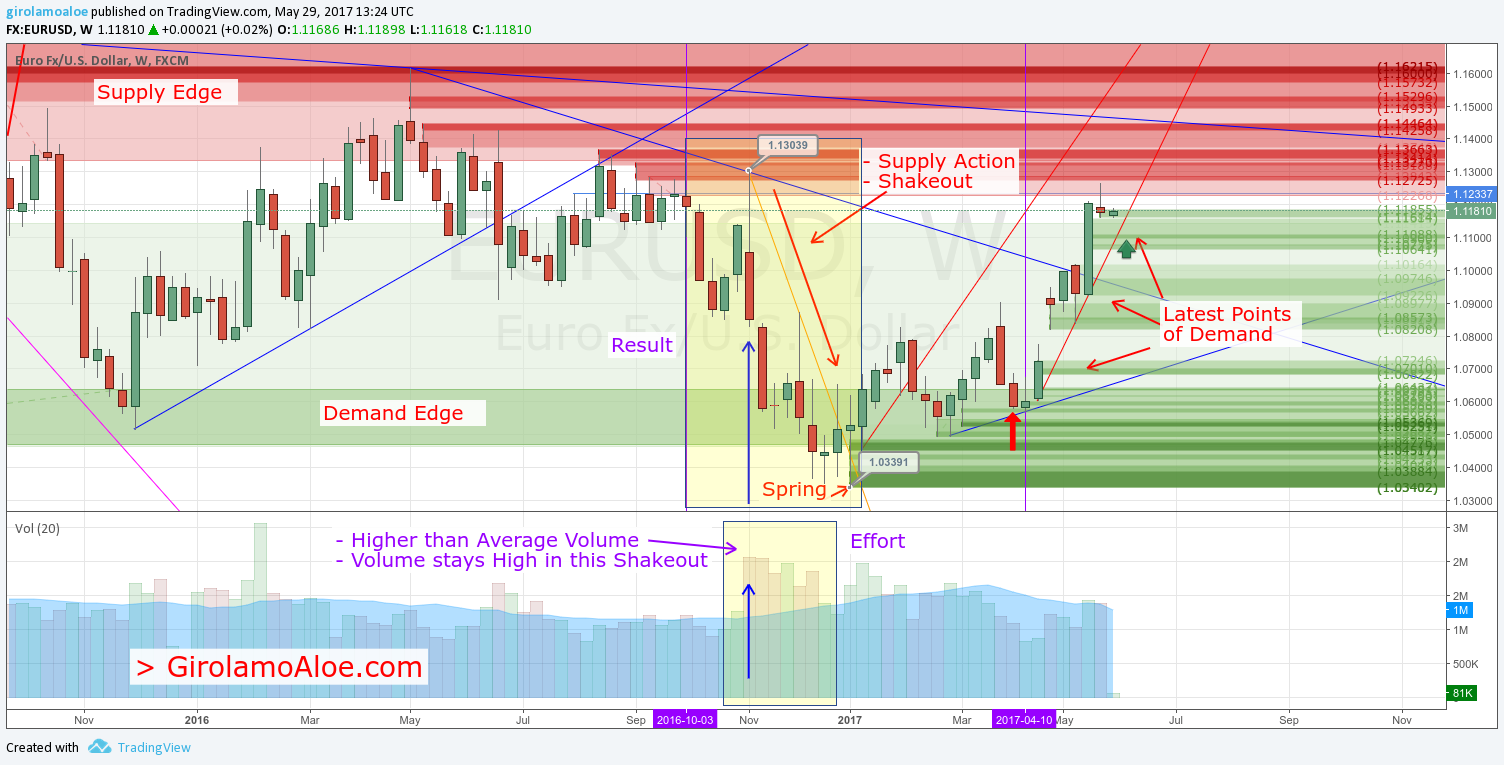
For example, a Shakeout or Terminal Shakeout can begin by a Supply Demand Actions.
Supply Demand Actions are one of the most important things to understand How to use Volume in Trading.
Harmony and Disharmony between Effort and Result in a Trend
Understanding How to use Volume in Trading means also to have clear how a trend works. Then, you must have clear what keeps up a trend.
Harmony and Disharmony between Effort and Result create important reference points. They show how the trend proceeds, what affects the price behavior and what to expect.
The Harmony shows no relevant imbalance between the Effort and the Result obtained.
The Disharmony shows a relevant imbalance between the Effort and the Result obtained.
The First Law of Wyckoff, the Law of Supply and Demand, shows how and what moves the price. But the Third Law of Wyckoff helps to enter the market in anticipation. The Law of Effort versus Result helps to find potential turning points to reverse a trend.
Harmony between Effort and Result
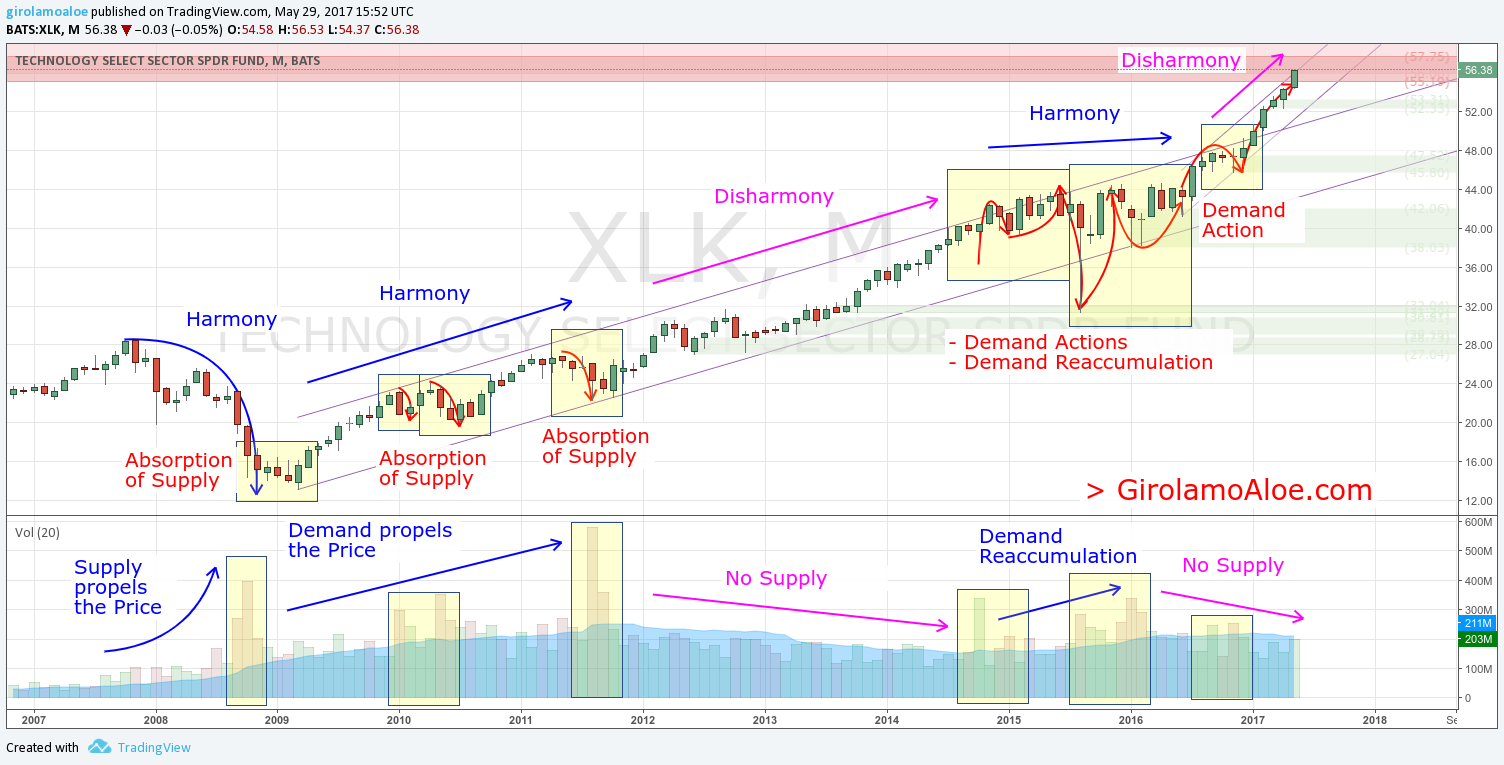
When Effort and Result are in Harmony the rising in volume supports the rising or the dropping of the price.
You can see the Harmony in these circumstances:
- Volume (Effort) higher than average and Price (Result) that increases or drops in a sharp way. This is what happens in Supply Action and Demand Actions.
- Demand propels the Price (Result) higher in a consistent way by the rising volume (Effort).
- Supply propels the Price (Result) lower in a consistent way by rising volume (Effort).
These circumstances are crucial to have clear how to use volume in trading. Sometimes, they have one thing in common: widespread candles as Result. Successful Forex Trades are able to catch these peculiarities among the Price Chart and the Volume Chart.
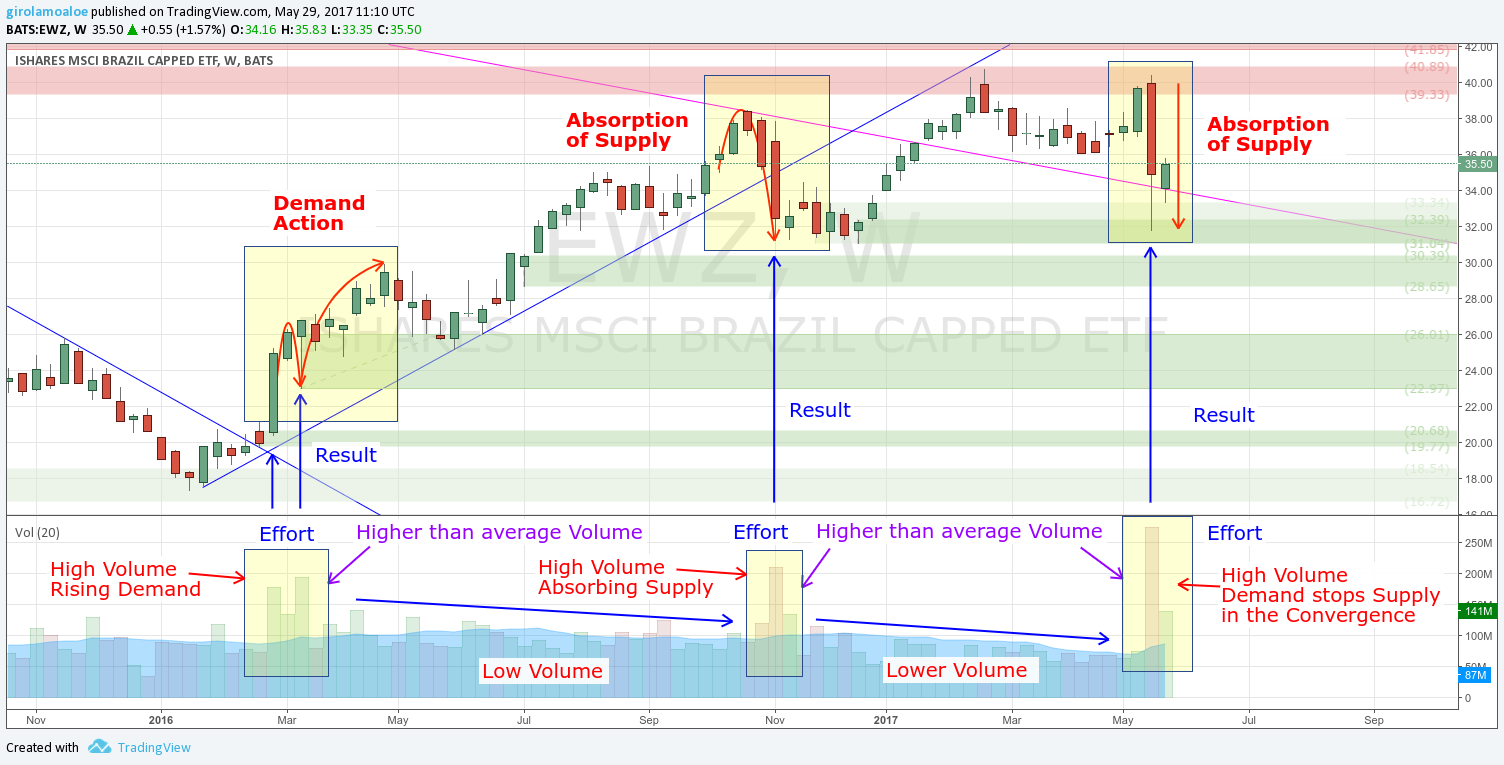
Disharmony between Effort and Result
When there is Disharmony a High Effort can show a Low Result. In the same way, a Low Effort can show a High Result.
You can see the Disharmony in these circumstances:
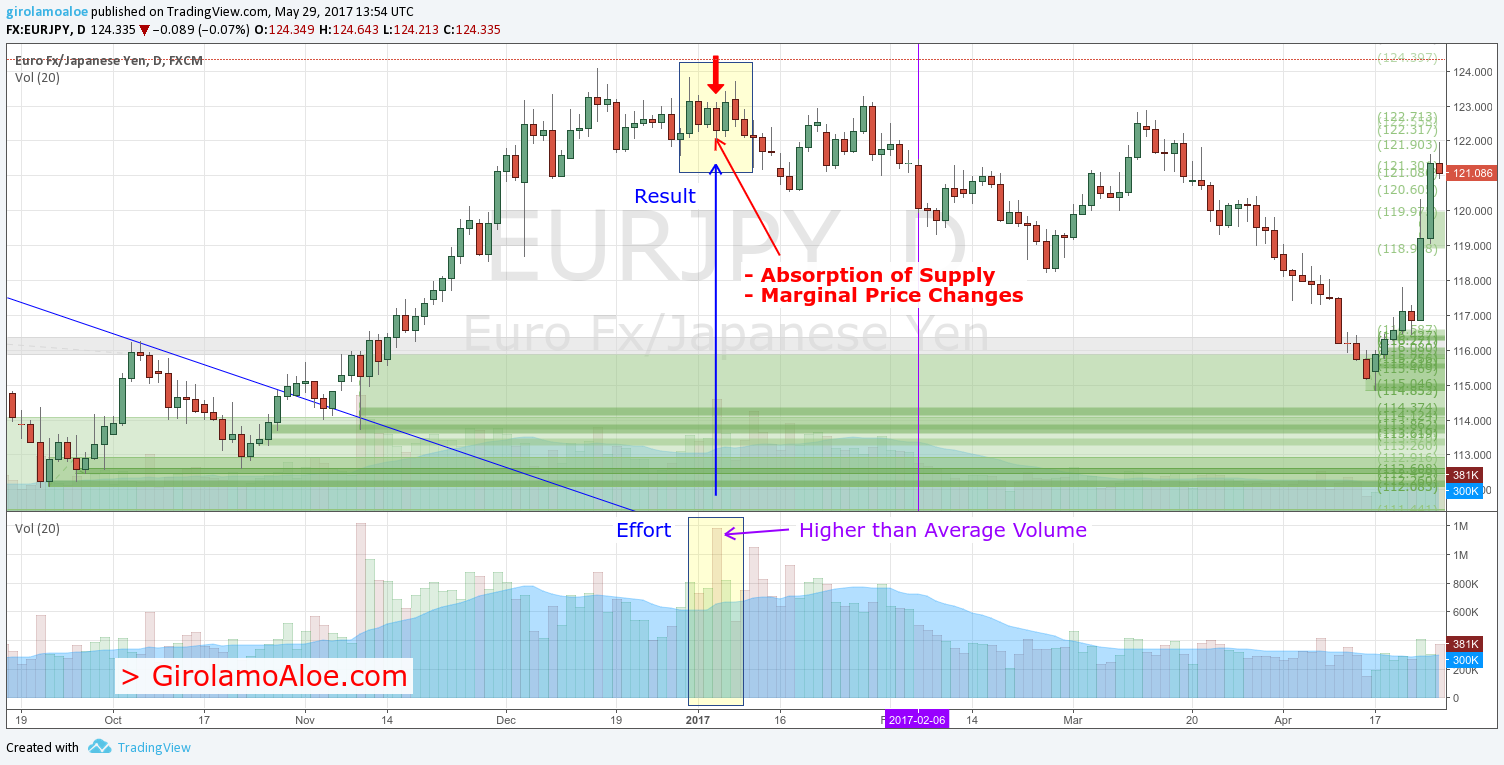
- Absorption of Supply or Demand by higher than average volume (Effort) with a marginal price (Result) changes.
- Absorption of Supply or Demand by increasing volume (Effort) and slowdown of the rising or dropping of the price (Result).
- Volume (Effort) decreases or stays low when the price (Result) continues to rise or drop.
These circumstances have in common narrow spreads in the price candles.
Absorption of Supply or Demand and Marginal Price Change
Large Interests can act to reverse a trend and to balance the result of a supply demand action.
The Absorption of Supply or Demand can show a higher than average volume with a Marginal Price Change.
Let me explain. Many times, the volume that increases higher than average causes two things:
- Stop of the previous price behavior.
- Marginal price change.
This happens because in the higher number of transactions buyers or sellers prevail.
The High Effort is in opposition to the Supply Demand willing that moved the market until that moment. So the High Effort stops the previous Supply Demand Action.
In these cases, the Absorption of a Supply Demand Action causes a marginal price change. In practice, the price almost doesn’t move.
How to use Volume in Trading by the Absorption of Supply or Demand
The Absorption of Supply happens when the rising of the volume has a prevailing of Demand.
So, new buy orders and cover-buy orders close the Supply Trades. Then, the demand takes and accumulates the securities that the supply are distributing.
The Absorption of Demand happens when the rising of the volume has a prevailing of Supply.
So, the new sell orders close the Demand Trades. Then, supply distributes the securities that the demand owned until that moment. So, the price is not more able to rise.
This can happen in any circumstance. But it takes high relevance on the Supply Edge of a Supply Distribution. In the same way, it takes high relevance on the Demand Edge of a Demand Accumulation. Then, where a Supply or Demand Action tests the continuation of the previous trend. It means, where the price can fail the continuation the previous trend.
The Composite Operator stops a Supply Demand Action. Its intention is to reverse the trend. So the Absorption of Supply shows the intention to reverse the trend to bullish. In the same way, the Absorption of Demand shows the intention to reverse the trend to bearish.
Conclusion
The Three Laws of Wyckoff are invaluable resources. Richard Wyckoff enunciated them at the beginning of the XX century.
The most of the retail traders ignore them or don’t know how to use them. But Chief Investment Officers of Hedge Fund firms know these rules very well and much more.
In 2013, Matthew Boesler wrote an interesting article about Wyckoff and Hedge Funds. He published it on Business Insider with this headlines:
The Secret Trading Strategy From The 1930s That Hedge Funders Don’t Want You To Know About.
Matthew Boesler, quoting an example, explained very well how the Large Interests work. I appreciated his post and the great value of the quotes and analysis he reported. His article opens the eyes, showing the truth about the trading practice.
The Law of Effort versus Result highlights the role of the Composite Operator. It shows where the Composite Operator is acting.
Indeed, by the trading volume, you understand that something is happening on market. Higher than average volume shows opportunities. So, your experience and training give you the possibility to use these changes in volume at the best.
The Volume is one of the most simple and ancient tools provided. If you trade with high-value brokers, it is a standard tool.
You open a chart you get the volume together with it. The reason is that this simple tool has a high importance when you trade shares. If you trade penny stocks, the trading volume is fundamental.
My students of Profiting.Me learn how to get advantage from the Trading Volume. They get all my tips about How to use Volume in Trading in the best way. They recognize how the effort changes the price chart.
Let me ask you a question:
- In which circumstances the Trading Volume was for you a very profitable resource?
George Papazov says
volume trading is a kind of trading that related with other tradings.
Girolamo Aloe says
You can use volume to understand how the market really works. It is one of the fundamental information about the market behavior.
Exchanges are tracked per time, per price, per trend.
These things show the market for what it is. They mark a market profile by different ways to track exchanges.
But today, financial mathematics is so good that you do not really need to analyze the exchanges.
DIMA JIRA CHIGUNDA says
MY QUESTIONS ARE
1 ) DOES TIMEFRAME MATTER WHEN LOOKING AT AN AREA THAT HAD HIGHER THAT AVERAGE VOLUME BAR ??
2) DO WE FOCUS ON A HIGHER THAN AVERAGE VOLUME BAR THAT SHOWS UP ON A DAILY BASIS OR VOLUME BAR OF THE WHOLE VOLUME INDICATOR OVER A CERTAIN PERIOD OF TIME LET’S SAY…A WEEK OR MONTH
Girolamo Aloe says
Hi. Time frame matters. So as High Volume matters in supporting of price action like breakouts. Indeed, you run the market as long as the price behavior marks outliers candle by candle. Outliers are just the result by the effort. According to the Second Wyckoff’s Law. High volume is the effort. The increasing in volatility is the result. The volatility marks candles which are statistic outliers.
How to recognize a static outlier related to a series of price candles? If a candlestick shows the closing price higher or lower than the high/low of the previous bar you see the increasing in volatility. Then, on break outs with high volume, you can get the beginning of a markup or a mark down. Matematically, the price progression is a Non-Gaussian Distribution of Asset Returns. Then, when it stays inside the volatility range, it does not show any anomaly. But running outside of it, the price is redifining the volatility range. It shows anomalies. These are outliers. You trade outliers because they define markup and mark down.
About the time frame, every occurrence you monitor is always relative. This means that every statistic occurrence has a relevance inside a specific contest. Changing the contest you need to valuate statistic occurencies for the new contest. In practice, if you get outliers in a specific time frame, it is relevant for those conditions which are specific for that time frame. The monitoring of different but consequent time frames gives a particular help. This is so because you consider that on both of these time frames there are positive occurrencies whih support a potential entry point. This happens starting from the higher time frame and going down to the lower time frame where you get the trigger to enter the market.
I hope this can help.